Insightful Sales Analytics Software for Restaurants
See real-time reporting on restaurant sales and labor so you can identify trends, opportunities, and inefficiencies. Lineup.ai’s cutting-edge restaurant analytics helps you act quickly and run your business like a well-oiled machine.

Features of Our Restaurant Analytics Software
Lineup.ai’s restaurant business intelligence and analytics software transforms raw data into powerful performance dashboards. Dig into insightful graphs and charts about your sales and labor costs to better predict food costs, revenue, inventory, and more.
Use this report to view each location's total sales by day or week and track performance over time. Keep a close eye on how restaurant sales are trending, running costs, and operational expenses. Our dashboard provides restaurant performance analytics through insightful graphs and charts.
Accurately predict labor demand using the actual vs. scheduled labor report. Easily compare scheduled with worked hours by location and within the timeframe you choose. Toggle between labor hours and dollars to analyze costs more closely. Use the visual chart at a glance or dig into the detailed table below it.
Easily compare sales across locations and against historical data. With restaurant POS analytics, you can track sales forecasts against actual sales and your four-week rolling average. Individual customer data feeds Lineup.ai’s restaurant analytics so you can use accurate insights to make smarter decisions.
See how well you’re staying within labor percentage targets with this report. View labor by location along with scheduled vs. actual labor percentages. Look back on past schedules or see your current labor breakdowns so you’ll know if you’re staying within targets or over-spending.
With Lineup.ai’s restaurant data visualization, you can arm general managers (GMs) with easily accessible real-time graphs and insights. Turn overwhelming data into clear visuals for efficient decision-making. Jumping between reports and time periods is a snap.
Our analytics dashboard is intuitive for anyone on your team to use. Easily toggle between comparisons, break down data by location, and set the timeframe you want. You can even annotate your reports, export, and share right from the dashboard. A helpful glossary is only one click away — just tap the blue, three-dot button on any report.
Analytics and Reporting Offer 360° Views in Your Restaurant
Get the answers to your biggest restaurant sales and labor questions through one innovative reporting platform. Spot sales trends, refine your menus, and see the impact on your bottom line from these actionable insights.
How Does It Work?
Get Analytics Overview From Your Dashboard
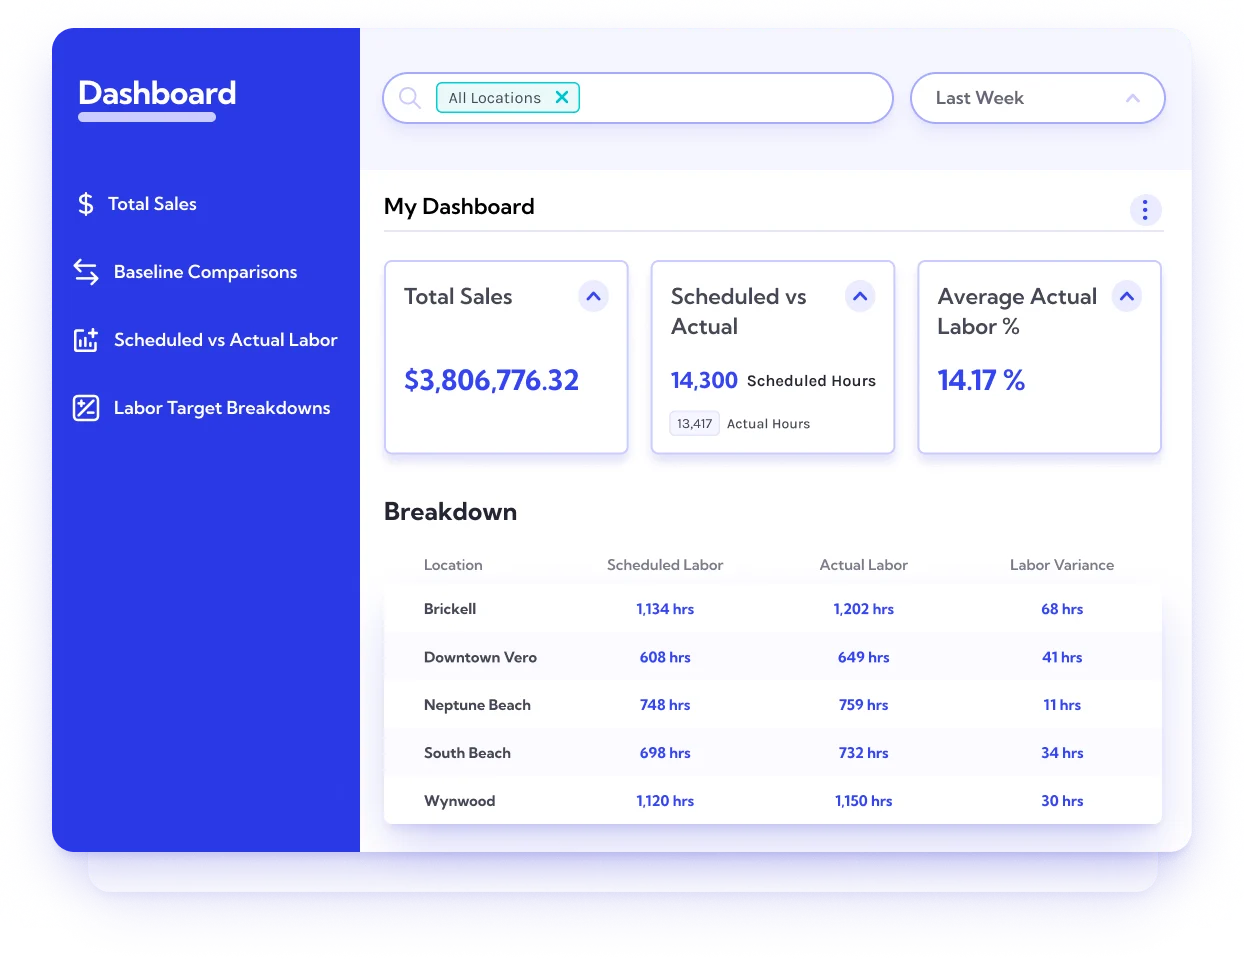
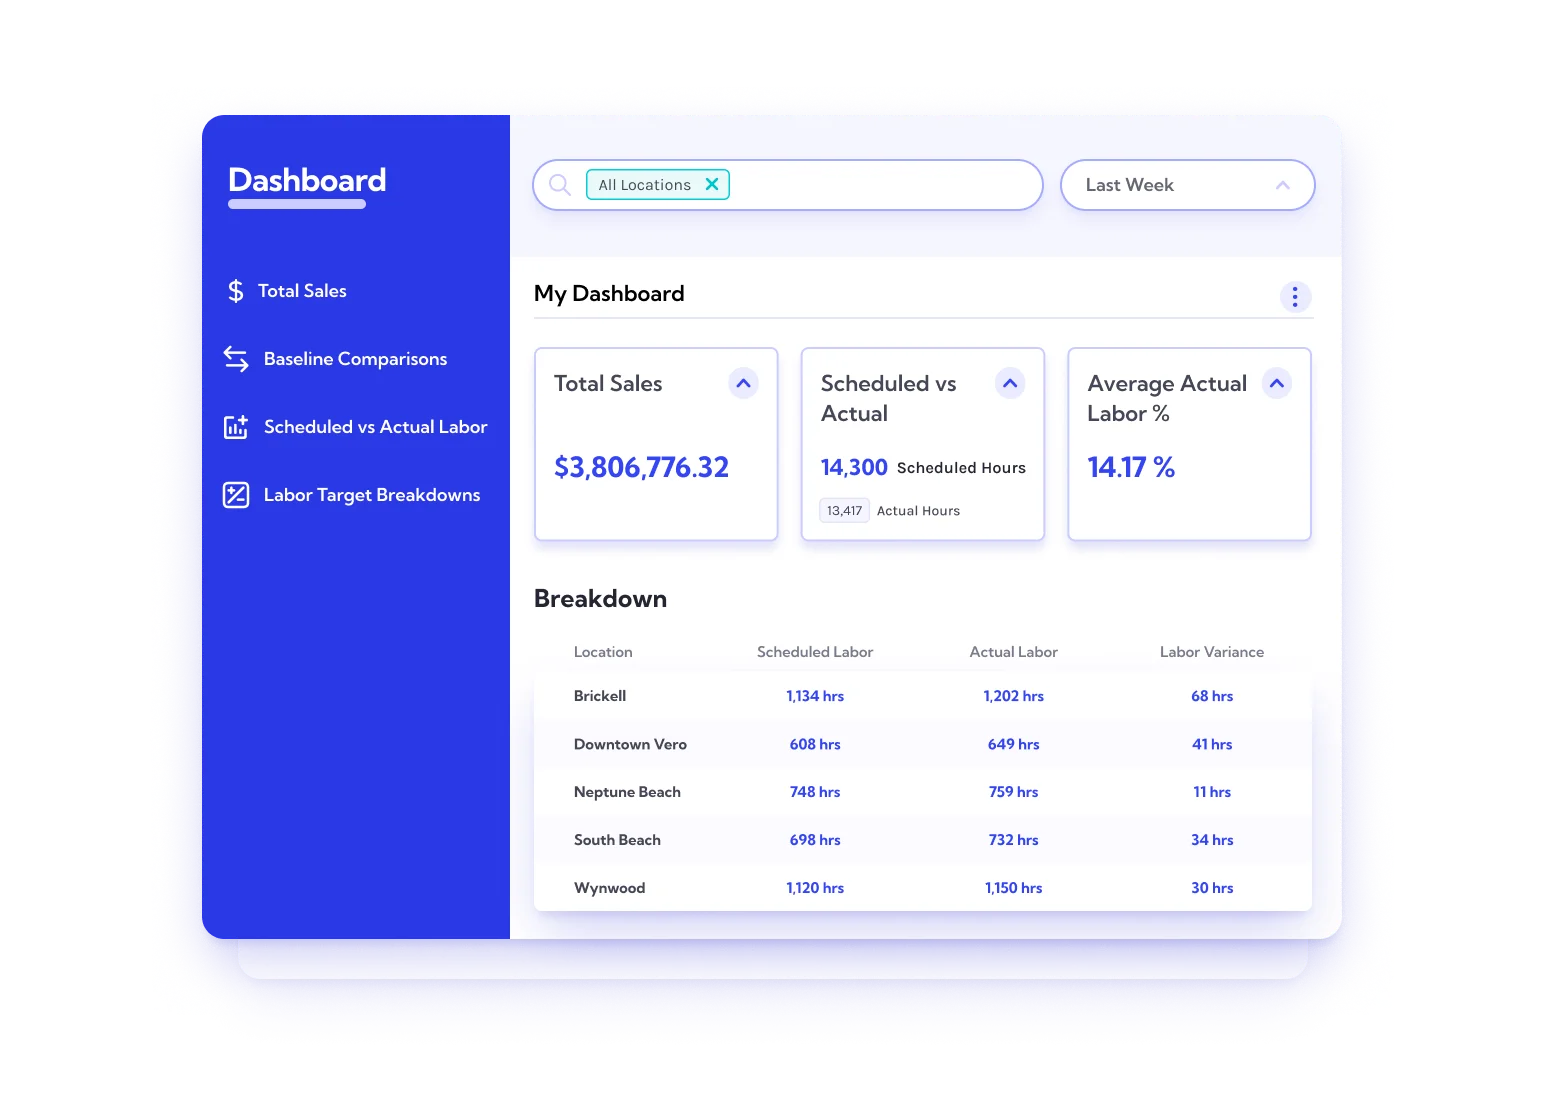
Your Lineup.ai dashboard shows you how your most important metrics are tracking in real-time. Get an overview of predicted vs. actual sales and labor any time of day.

"Over the last year, we have leveled out labor so it is much more manageable and predictable.”

Frequently Asked Questions
Find answers to questions we're often asked. Don't see it here? Drop us a line!
How accurate is Lineup.ai analytics software for restaurants?
Lineup.ai is 35% more accurate than traditional forecasting methods. That’s because our AI-powered restaurant forecasting software relies on your own historical data plus external factors such as weather, events, and more. Here’s what one customer had to say about the accuracy: “After a few months of watching the sales forecasting we noticed that Lineup.ai was within 2% or 3% of actual sales.” Check out the full case study to read more.
Is Lineup.ai accessible to everyone at my restaurant?
Yes, anyone who wants to use Lineup.ai at your company can. You can add users and set different permission levels depending on each person's role. For example, managers might need the ability to build schedules, while employees just need to be able to view them and request shift swaps. Lineup.ai also allows you to add different locations so that all your restaurant data is in the same place.
Where can I see and create reports?
Right from your dashboard! Open Lineup.ai, and you’ll be greeted by several insightful charts and tables showing your sales and labor breakdowns. You can dig into each one and use this data for scheduling, forecasting, and more. Set the timeframe, toggle between different comparisons, and find the answers you need. From the report, simply annotate and export or share directly from Lineup.ai.
What can I do with my Lineup.ai reports?
Most customers use reports to predict labor needs, schedule efficiently, forecast future sales, and make data-driven decisions. For restaurants that are looking to grow or improve operations, Lineup.ai can be a powerful tool for tracking performance and seeing how prepared you are for the future. You can share reports with stakeholders, use them to check in with GMs at different locations, and make sure you’re on track with your overall business goals.
Ready to get started?
Drive operational efficiencies by gaining a clear view into your restaurant analytics. Lineup.ai can help you prepare for every shift and any growth in the future.